A new study from the Out of Home Advertising Association of America shows out of home advertising delivers 2x the performance lift of broadcast and connected TV.1 The analysis covered hundreds of campaigns across 7 verticals using device-level data. The findings reframe where OOH belongs as a performance channel in a Canadian media mix. Here is what changes for H2 planning, and the numbers media buyers need to defend the spend.
Why OOH Is Now a Performance Channel CTV Cannot Match
OOH delivered a median 20% lift on in-person outcomes and a 14% lift on digital outcomes.1 Both connected TV and broadcast came in at roughly 10% on the same measures.1
The framing that OOH is for brand and digital is for performance no longer holds when device data ties physical exposure to digital action. The OAAA and Kochava study is the first third-party benchmark that lets Canadian planners call OOH a performance channel without footnotes.
The QSR Signal
In quick service restaurant campaigns, OOH preceded search 96% of the time and social 94% of the time.2 Last-touch attribution rewards the channel closest to the click. It misses the channel that triggered demand. That is part of why paid search costs keep climbing while volume stays flat. Contextual DOOH triggers like weather and time of day make that upstream signal even stronger.
The 7-Day Conversion Cycle Changes How DOOH Should Be Planned
Conversions resurface weekly after exposure. The Kochava3 data identified a recurring 7-day cycle of resurfaced conversion activity.2 The conversion rate also climbs 7.1x from 1 to 10 ad exposures, the steepest frequency curve in the study.2
For Canadian planners, two implications.
- A 2-week DOOH burst hits the consumer with 2 conversion cycles, not 14 days of linear decay.
- A 7-day attribution window misses the second cycle entirely. Extend to 14 days minimum.
Adapt Media's national DOOH coverage with neighbourhood-level relevance, paired with mobile retargeting across 22M+ Canadian phones tied to DOOH exposure, gives Canadian marketers the same OOH-to-digital signal the study measured.
Where the Performance Channel Story Lands: Retail, Automotive, QSR
Retail, automotive, and quick service restaurants were named the top-performing categories.1 Retail environments produced a median lift as high as 25%.1
That tracks with how those categories shop. Retail decisions happen close to the point of purchase. Automotive decisions happen in transit. QSR decisions happen on commutes and around impulse triggers.
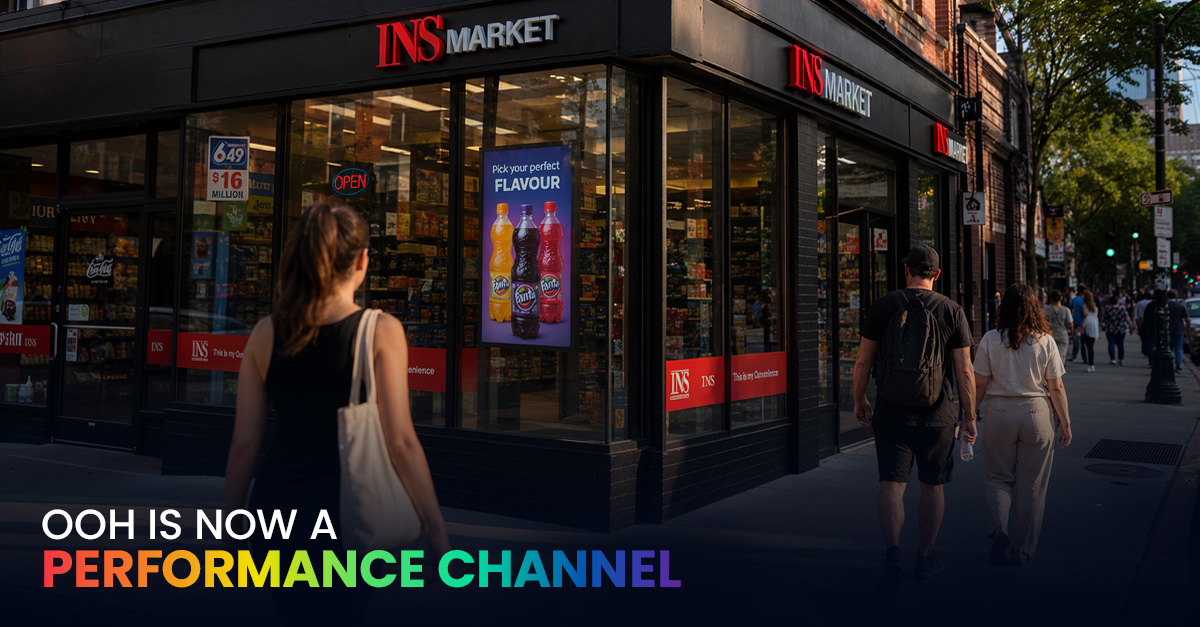
Adapt Media's Circle K Network, Independent Convenience Store Network, and INS Network put DOOH inventory inside the shopping moment, exactly where the data shows OOH influences both immediate and planned behaviour. For broader retail formats, the same logic applies to grocery store advertising.
What Canadian Marketers Should Do in Q3 and Q4
By the Numbers
- 20% median in-person lift from OOH
- 14% median digital lift from OOH
- 10% benchmark lift from CTV and broadcast TV
- 7.1x conversion rate increase from 1 to 10 exposures
- 25% top lift in retail environments
Model a Reallocation
Run an incremental lift hypothesis on the CTV and broadcast lines in your H2 plan. Model what a 10% to 15% shift from CTV to DOOH does to projected outcomes. A reallocation backed by third-party data is harder for a CFO to push back on than a creative argument.
Extend Your Attribution Windows
Move OOH attribution to a 14-day window minimum. A 7-day window cuts the data short before the second conversion cycle surfaces. Most agencies are still defaulting to 7. That is a measurement gap working against the channel.
Plan in Bursts, Not Trickle
Plan DOOH flights in 2 to 4-week bursts rather than always-on schedules. Frequency drives the steepest conversion curve in the medium. Consolidated exposure hits the multiplier faster than diluted spend.
The marketers who win the next 2 quarters will be the ones who treat DOOH as a performance channel before their competitors finish updating their decks.
FAQ
Is OOH a performance channel?
Yes. The May 2026 OAAA and Kochava study found OOH delivers a 2x performance lift over connected TV and broadcast TV, with a 20% median in-person lift and a 14% digital lift.
How does OOH compare to CTV?
OOH outperformed both CTV and broadcast TV. OOH delivered 20% in-person and 14% digital lift. CTV and broadcast came in at roughly 10% on the same measures.
How is OOH measured for digital outcomes?
Device-level data links physical ad exposure to subsequent online actions including website visits, branded search, and app downloads. Attribution windows should extend to 14 days to capture the full 7-day cycle effect.
What categories see the biggest lift from OOH?
Retail, automotive, and quick service restaurants. Retail environments produced a median lift as high as 25% in the OAAA and Kochava analysis.
Why does frequency matter so much for OOH performance?
The study found a 7.1x conversion rate increase from 1 to 10 exposures, the steepest frequency curve of any medium measured. OOH builds consideration without irritation because exposure is passive and contextual.
Talk to Adapt Media
Contact the Adapt Media team to translate the OAAA and Kochava findings into your H2 media plan.
References
- Out of Home Advertising Association of America. "OOH Delivers 2x the Performance Lift of TV, New OAAA and Kochava Study Finds." https://oaaa.org/news/ooh-delivers-2x-the-performance-lift-of-tv-new-oaaa-and-kochava-study-finds/. Accessed May 2026.
- Globe Newswire (OAAA via). "OOH Delivers 2x the Performance Lift of TV, New OAAA and Kochava Study Finds." https://www.globenewswire.com/news-release/2026/05/12/3292986/0/en/OOH-Delivers-2x-the-Performance-Lift-of-TV-New-OAAA-and-Kochava-Study-Finds.html. Accessed May 2026.
- Kochava. Company homepage. https://www.kochava.com/. Accessed May 2026.